Revenue-Weighted Prioritization: How Savio Ranks Feature Requests by MRR
Five votes from $50 customers, or one vote from a $5,000 customer. A vote counter says the first request wins by five to one. Weighted by revenue it is $250 against $5,000, and the second request wins. Savio built its whole product around that second answer, so we spent an evening inside a trial workspace to study how they did it.
This is a Field Notes piece: an evening inside the product, the parts we admire, the rough edges we hit, and the version we built for Usero before the night was out. The Savio screenshots come from a hands-on 14-day trial with sample data, no card, no sales call.
An attribute, not a field
The first design decision is the one we kept coming back to. Savio has no hardcoded “MRR” field. Instead, any company attribute can be flagged as “stores the customer’s MRR” and gets a dollar icon. The default attribute is named monthly_spend, the display name is yours to set (the sample workspace calls it “Sample MRR”), and the flag is what lights up every revenue surface in the app.
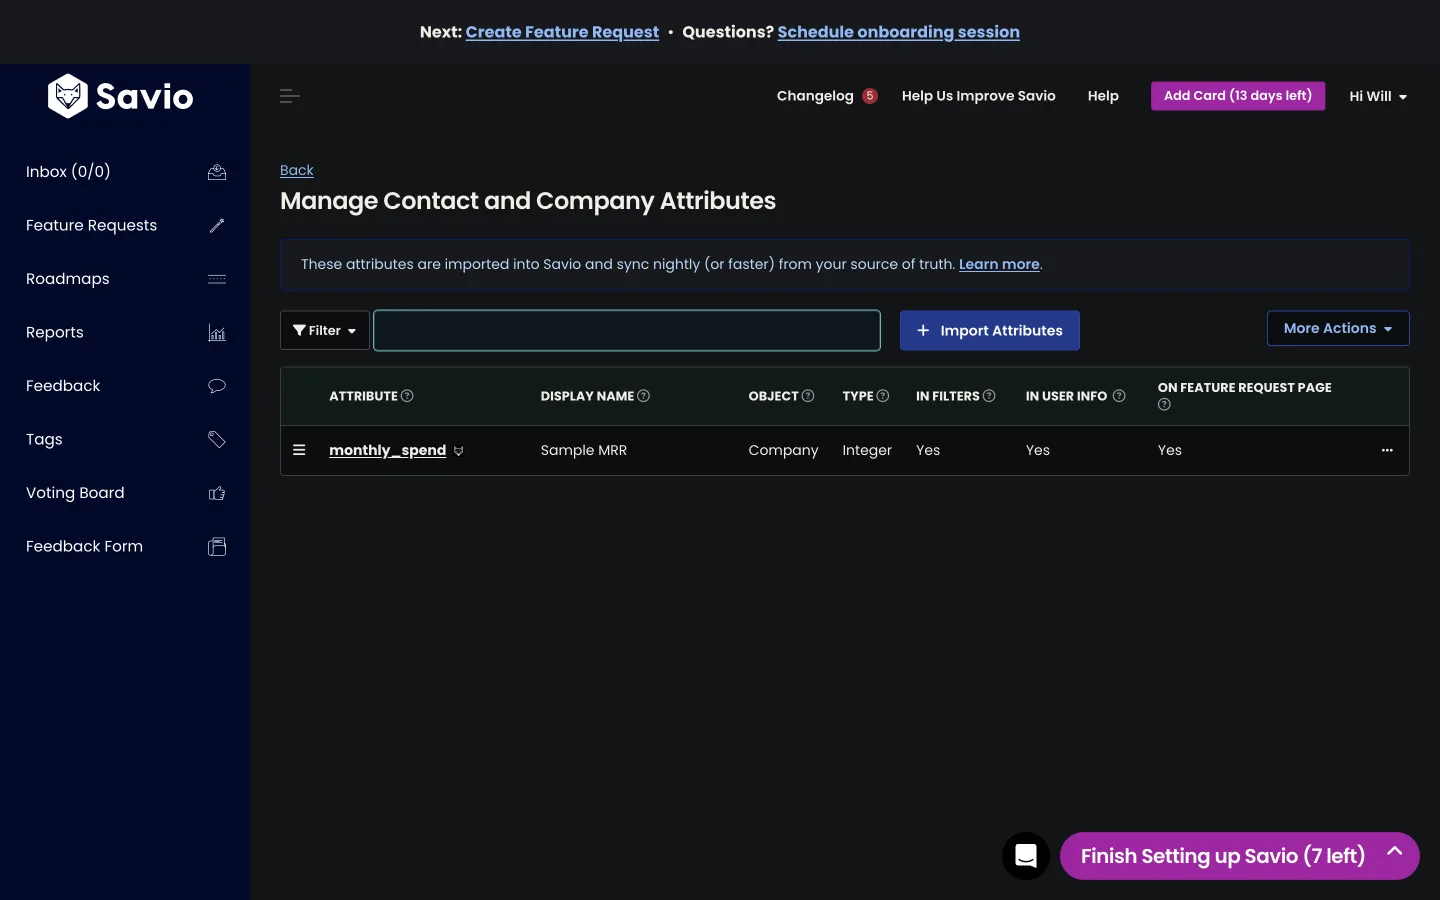
The payoff of doing it this way: one attribute system powers columns, filters, contact panels, and report metrics for anything a company record holds. Plan, seat count, renewal date, MRR, all the same machinery. The MRR flag is a single bit of metadata on top. We would guess this fell out of building the attribute system first and the revenue feature second.
The join that makes it trustworthy sits one layer down. Every piece of feedback in Savio requires a contact, and contacts belong to companies. That discipline is enforced at the create-feedback form, whose first field is “The problem this customer has is (include verbatim if possible)”. Every dollar in a request’s total traces back to one contact’s feedback, so a request with no contact attached has no number at all.
Who is asking, as dollars
Once the attribute is flagged, the feature request list can show it as a column. The number per row is the sum of MRR across all companies whose feedback links to that request, and the column sorts. Sorting by it is the core view of the product: your backlog ranked by how much monthly revenue is attached to each ask.
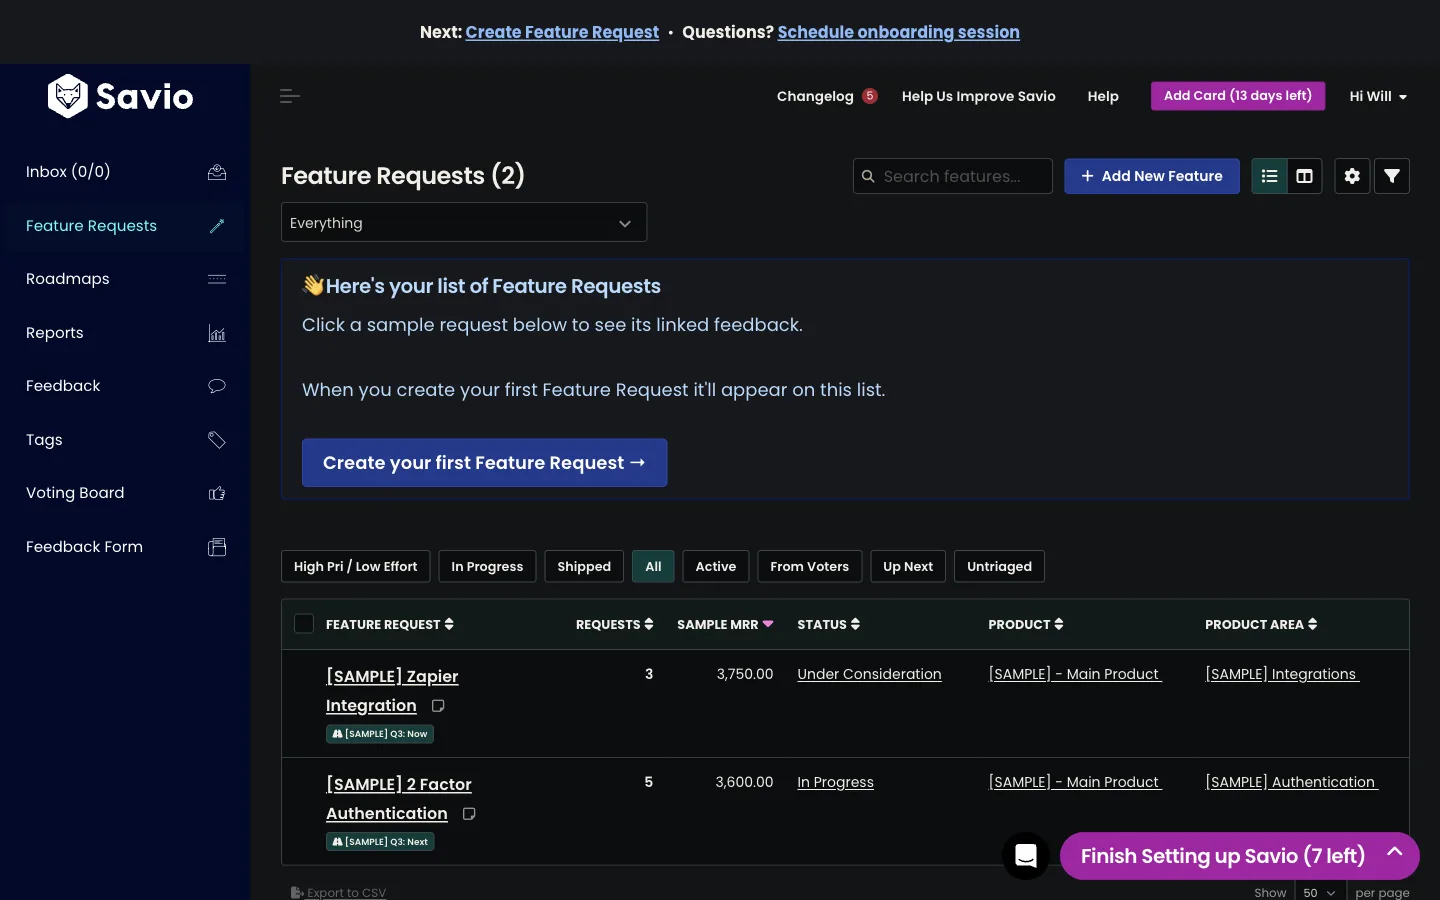
A small wrinkle worth noting: the MRR column is not built in. You add it yourself via “Pick attribute to display on FR list” in the column settings, and a banner walks you through connecting customer data first. More on that trek later.
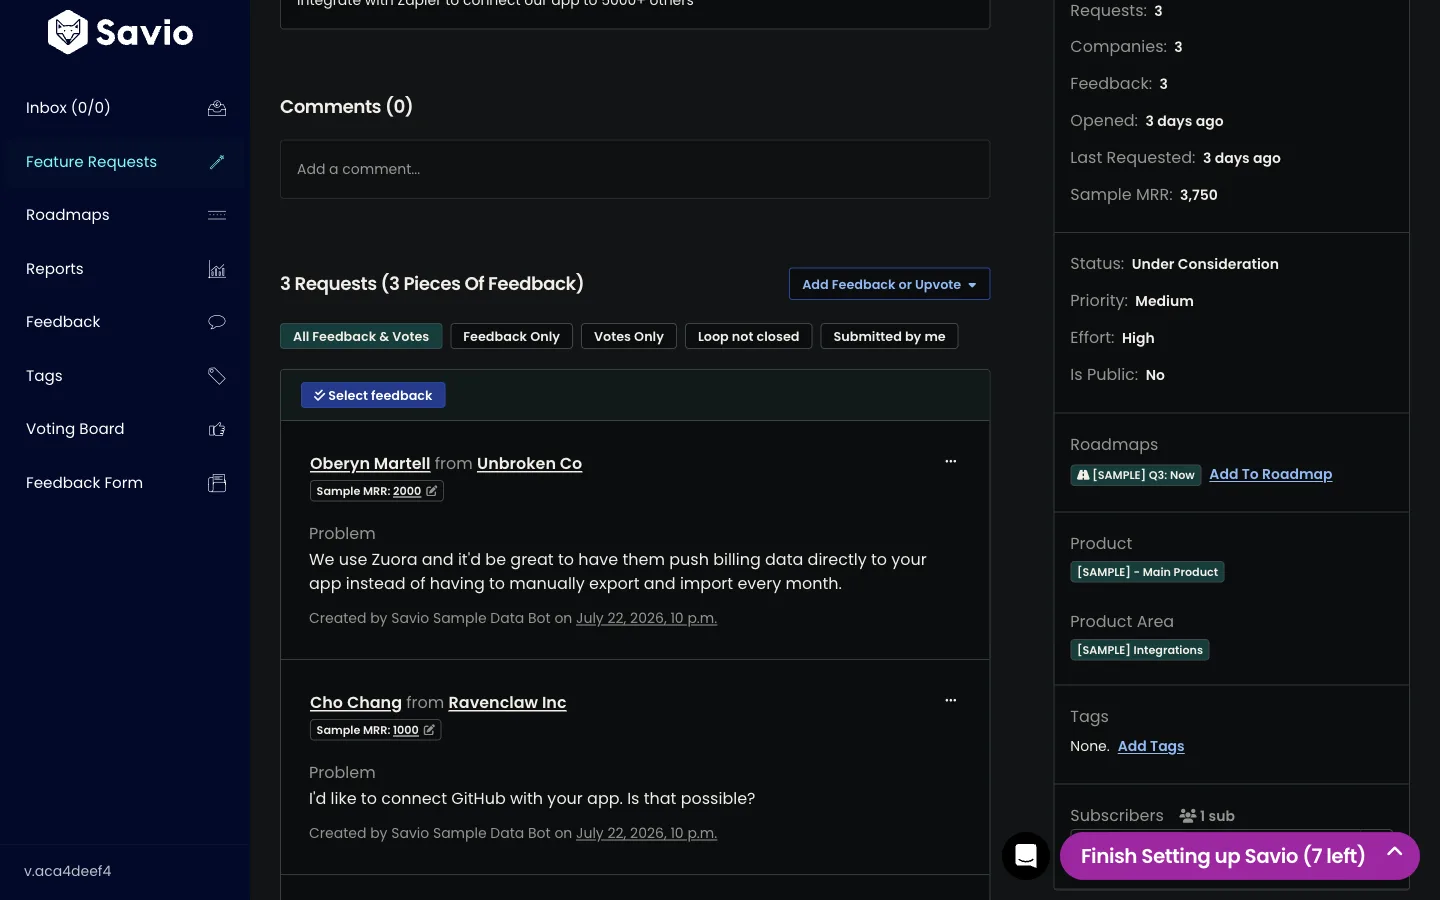
Open a request and the sum decomposes. The sidebar shows the cumulative figure next to counts of requests, companies, and feedback items, and each linked piece of feedback carries a per-company chip (“Sample MRR: 1,500”) with an inline pencil to edit it. You can see exactly which customers make up the total, which keeps the big number honest.
The manual fallback is a feature
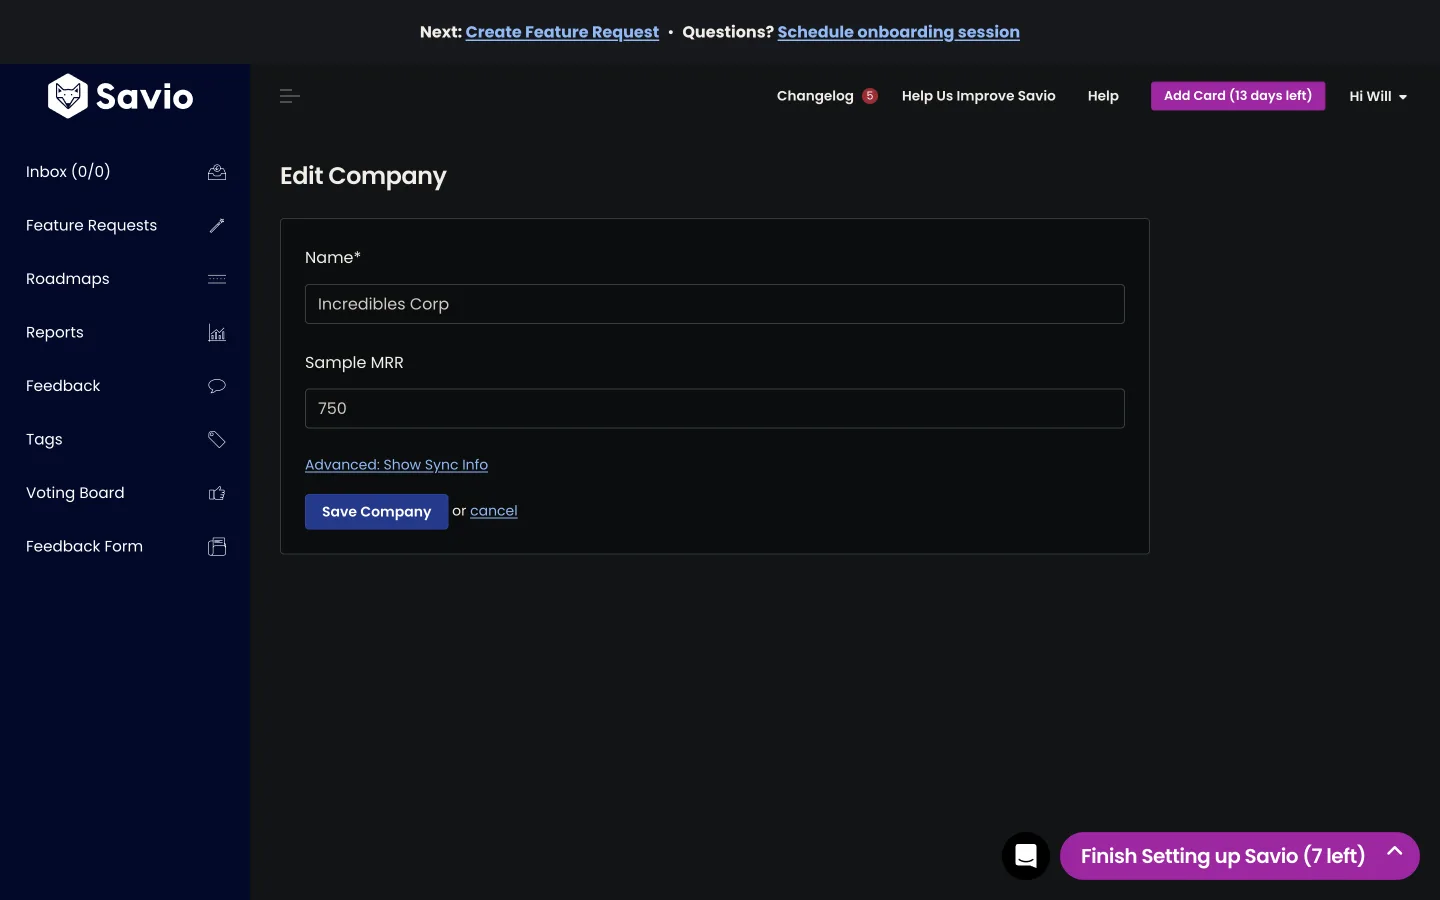
Here is a choice we want to applaud. The Edit Company form is three things: a name, a Sample MRR box, and an “Advanced: Show Sync Info” toggle. The whole revenue layer runs on hand-entered numbers, no integration required. That is how our trial workspace worked for the entire evening, and it is why the feature demos on day one instead of after a week of CRM plumbing.
The sharpest idea: filters recompute the dollars
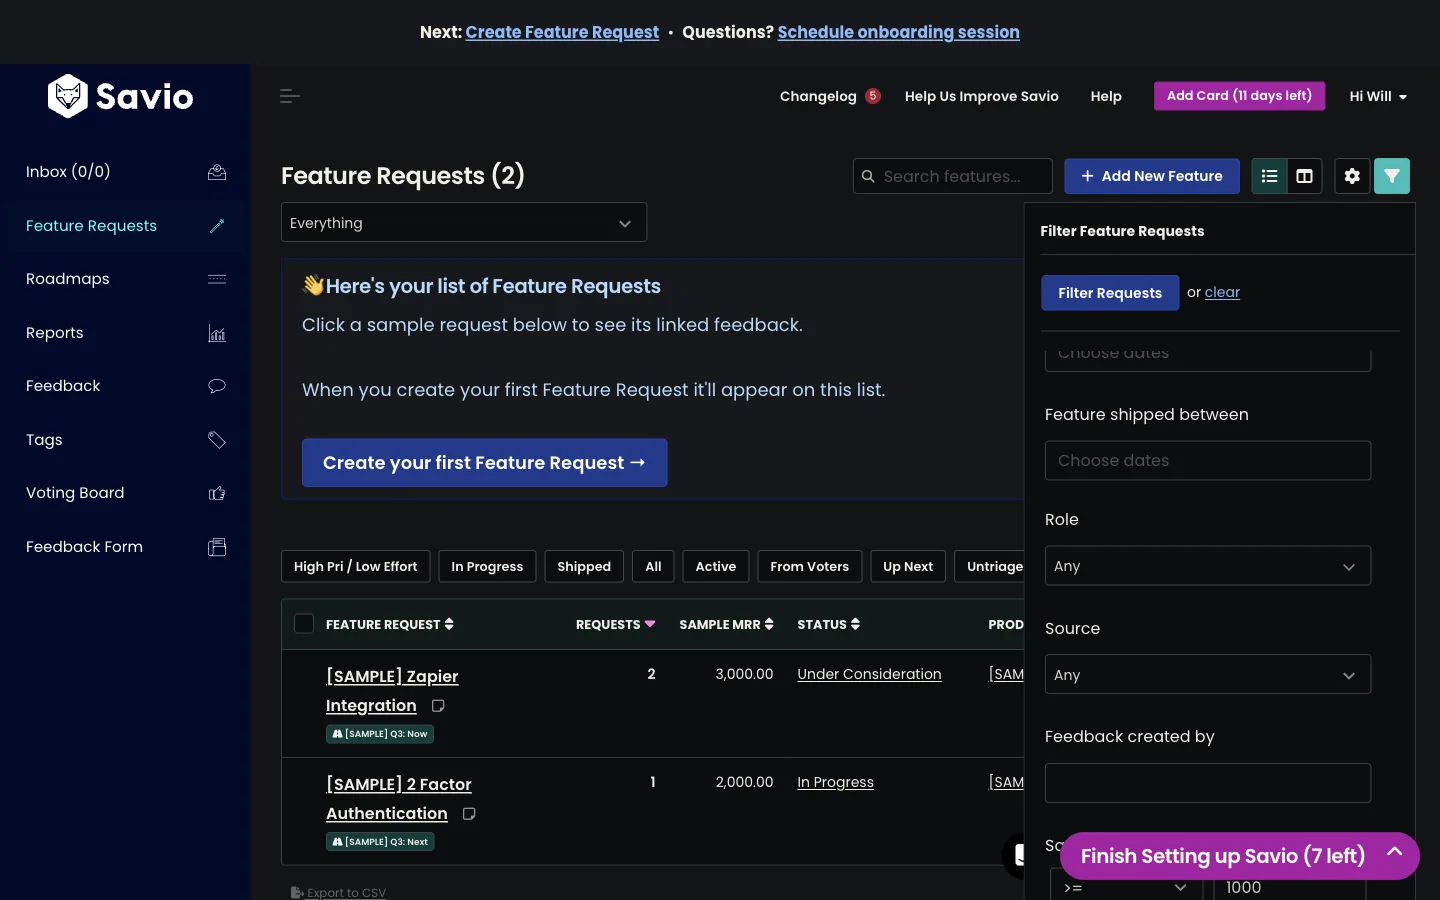
This is the detail we came away wanting to steal. Filter the list by the MRR attribute (“Sample MRR >= 1000”) and Savio recomputes the sums instead of hiding rows. Take one row from our workspace. The Zapier Integration request totaled 3,750 MRR unfiltered, summed across 3 contributing entries. Apply the “Sample MRR >= 1000” filter and the one entry from a company paying under $1,000 drops out of the sum, not just out of view, so the same row recomputes to 3,000 across 2 and the list re-ranks around the new total. Now the column measures revenue only from companies over your threshold. A PM segmenting by spend wants exactly that, and most tools would have shipped show/hide and called it done. The catch: the row keeps its “Sample MRR” label while the number underneath changes meaning. The 3,000 you see filtered is not the 3,750 from a minute earlier, so it is easy to carry a filtered figure in your head and compare it against an unfiltered one later.
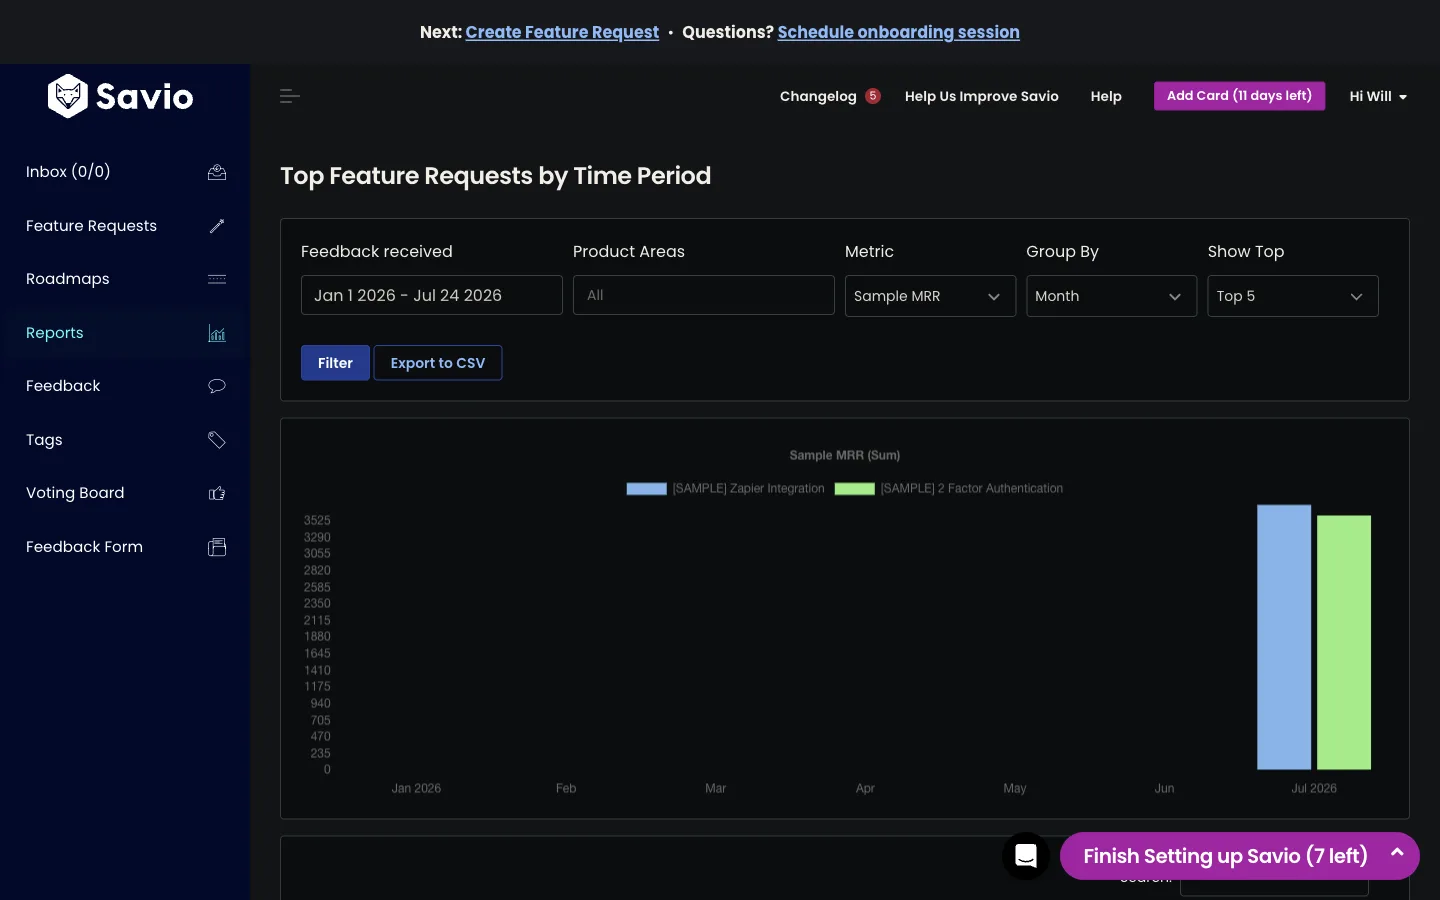
The same idea carries into reports. “Top Feature Requests by Time Period” has a Metric dropdown with Total Feedback, Unique Requests, Unique Companies, and Sample MRR, and picking the last one turns the chart into a revenue-weighted view. The option’s form value is a dynamic attribute id (fa_61474 in our workspace), so reports run off the flagged attribute too, the same machinery end to end.
The rough edges we hit
A few honest notes from the same evening, offered in the spirit of a team that has shipped plenty of rough edges of its own.
- The filter and the column measure different things. The column is a cumulative sum across companies; the filter tests each company individually. We set “Sample MRR >= 3700” expecting to catch the 3,750 row and got zero results, because no single company on that request pays 3,700. Correct behavior, and still a trap. A word of copy near the filter would save the next person our five minutes of confusion.
- Setup is a trek. The full loop wants a support tool for feedback, a customer source of truth for attributes, an attribute flagged, and a column configured, spread across several settings pages. A “Finish Setting up Savio (7 left)” checklist follows you the whole way, which is a fair acknowledgment of how many steps there are.
- The automated path costs $249 a month. Salesforce, HubSpot, and Segment sync live on the Business tier. Essential at $39 and Professional at $79 get revenue weighting through support-tool attributes or manual edits. We should flag that we did not connect a real source of truth ourselves: the auto-import and its nightly-or-faster sync cadence are what Savio’s docs describe, not something we observed running.
- No AI in the loop. Linking feedback to feature requests, deduping, and grouping are all manual in Savio. The revenue math is only as good as the triage feeding it, and the triage is a human reading tickets.
None of that dents the core design. The attribute system, the mandatory contact link, and the re-aggregating filters are careful work, and studying them shaped what we built next.
What we built the same night
Usero already had the plumbing Savio’s design depends on: a Person record per user, feedback linked to people, and an identify() call that accepts arbitrary traits. What was missing was the revenue layer on top. So we added it.
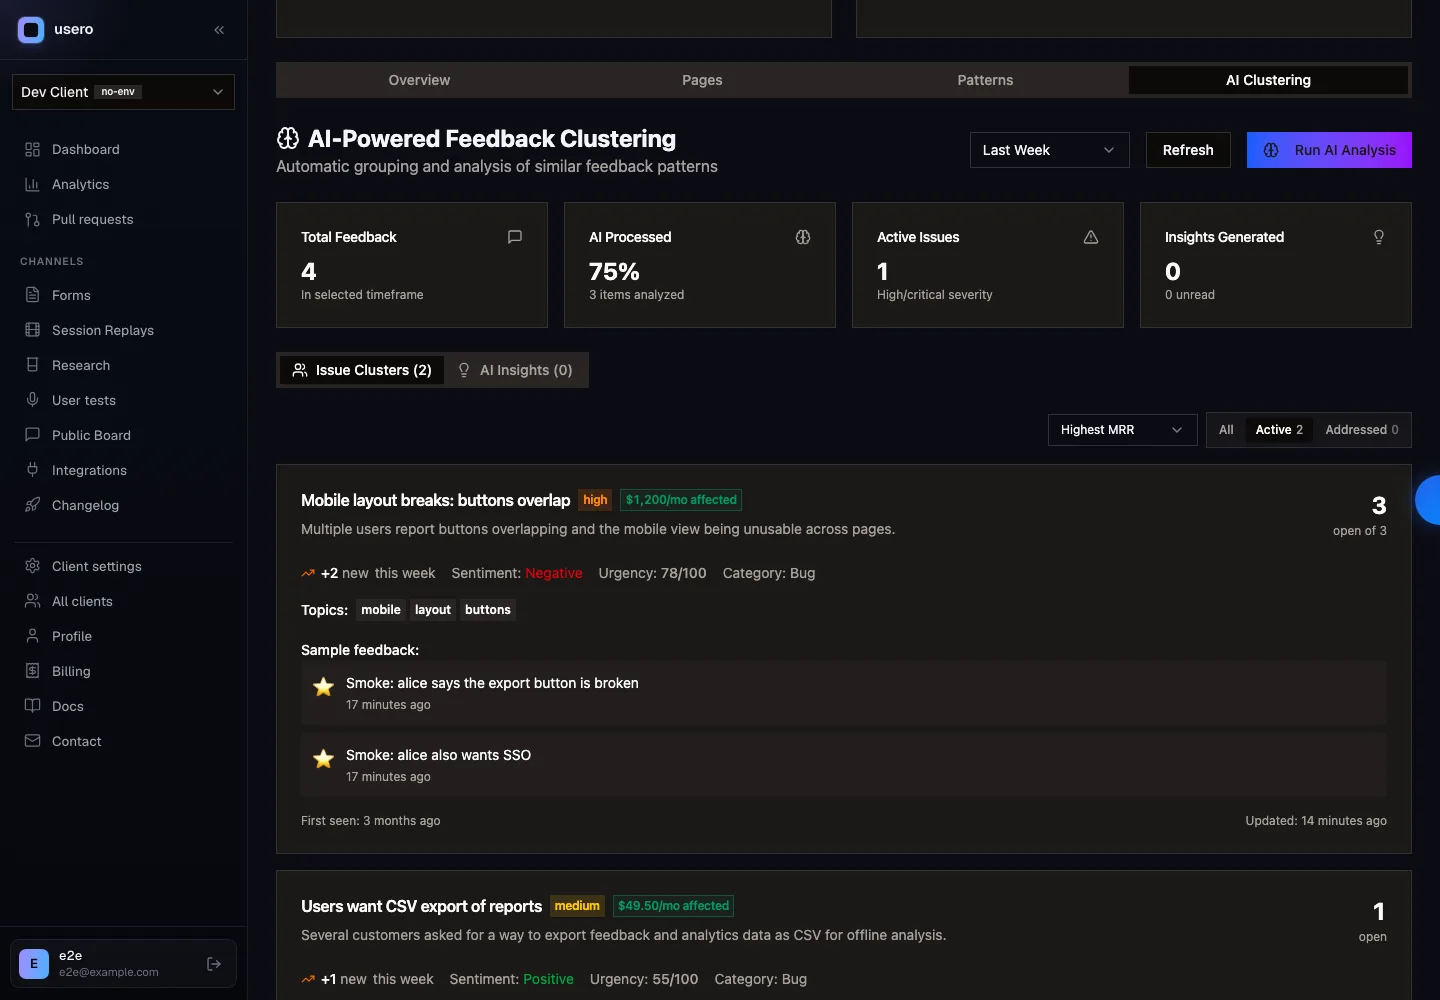
Pass identify({ traits: { mrr: 499 } }) from your own code, one line next to wherever you already identify the user at login, and the number lands on the person. The inbox and the AI clusters then show revenue sums and can sort by them. Our ICP is developers shipping their own product, and their code already knows what each customer pays, so the number can come from the source instead of routing through a CRM. That is the piece Savio gates at $249 a month, and for a developer it is an afternoon of nothing.
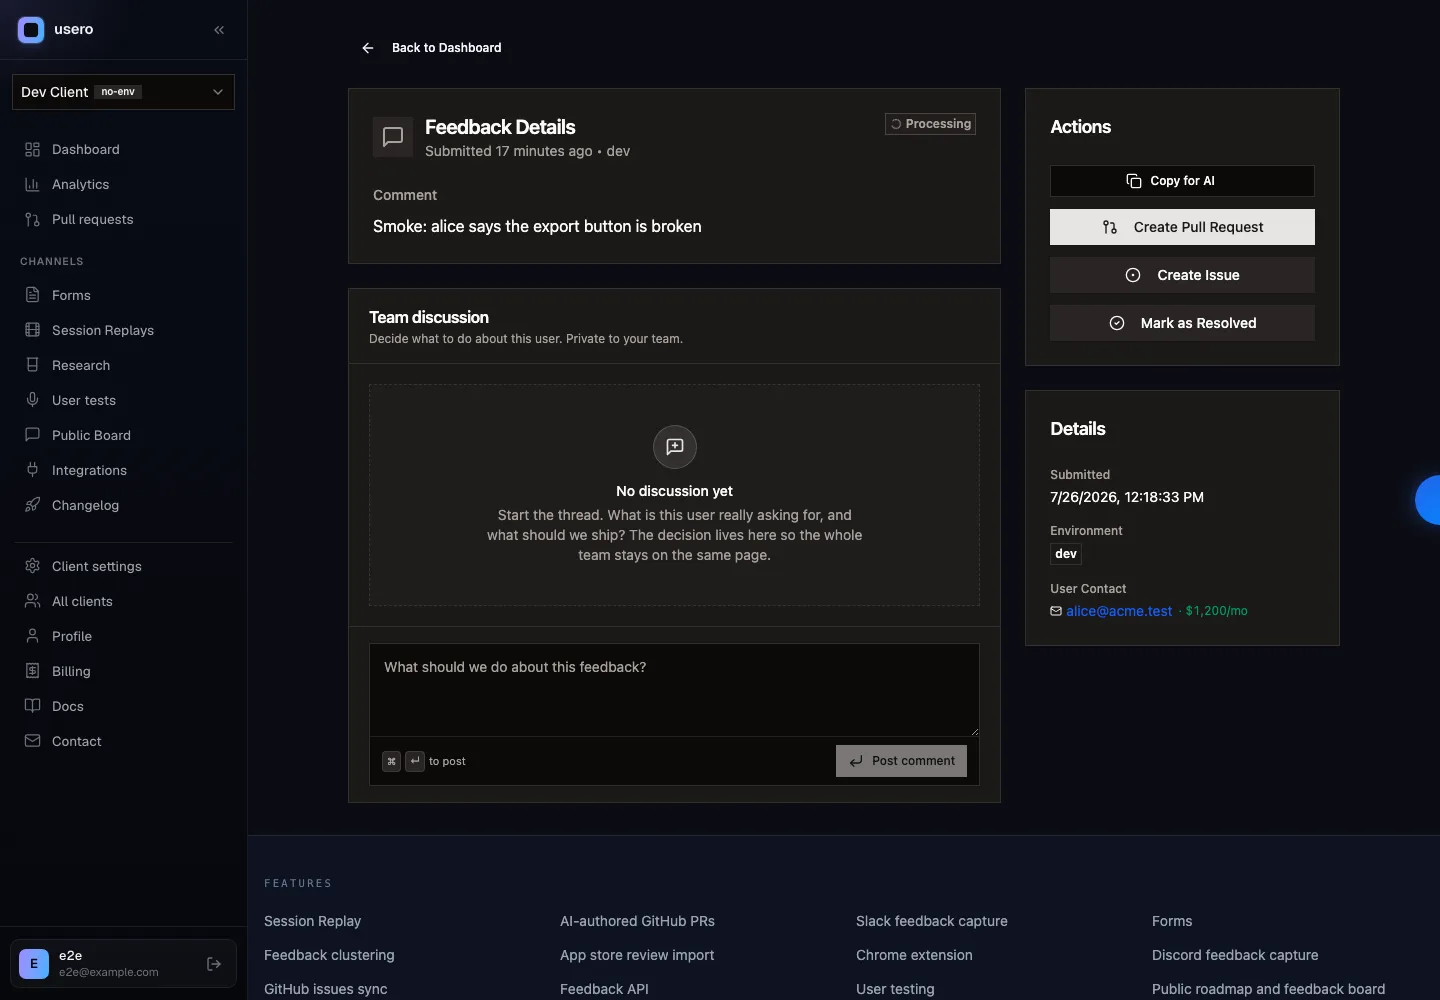
Two choices we made deliberately after the evening in Savio. Sums are computed over distinct people, so five tickets from one $500 customer stay $500 rather than inflating to $2,500. And the weight lands on clusters, the groups our AI already builds from raw feedback, so “$X of MRR is asking for this theme” appears without anyone manually curating feature requests first. Savio weights the feature requests a human triaged into existence. We wanted the dollar figure to land on the groups that form on their own.

Scope honesty: this is a first slice, sitting in review on a branch as we publish, not yet live for customers. No CSV import of revenue yet, no Stripe sync, no revenue-weighted reports. Savio’s re-aggregating filters are on our list too, because that idea is too good to leave in their app.
The takeaway
Savio’s revenue weighting is a well-built answer to a real question, and the craft is in the quiet decisions: an attribute flag instead of a hardcoded field, a mandatory contact on every piece of feedback, filters that recompute the dollars. The cost is setup work and a $249 tier for the automated feed, and the numbers rank whatever a human has manually triaged. We took the ideas we admired, attached them to clustering that runs on its own, and fed the revenue in through one line of code.
If teardowns like this are your thing, the first Field Notes piece walked through how Canny Autopilot works. Or you can try Usero free and see what the clustering finds in your own feedback.
Frequently Asked Questions
What is revenue-weighted prioritization?
Ranking feature requests by the revenue of the customers asking, rather than by raw vote count. Each piece of feedback is linked to a person, each person to a company, and each company carries an MRR figure. The feature request list then shows a dollar sum next to each request: how much monthly revenue is asking for this. Five votes from $50 customers total $250; one vote from a $5,000 customer totals $5,000, and it ranks accordingly.
How does Savio attach MRR to feature requests?
Through its company attribute system. Any company attribute (default name monthly_spend, display name settable) can be flagged as "stores the customer's MRR", marked with a dollar icon. Every piece of feedback in Savio requires a contact, and contacts belong to companies, so once an attribute is flagged, Savio sums it across all companies whose feedback is linked to a feature request. The sum appears as a sortable column on the request list, as per-company chips on the request detail, in filters, and as a report metric. Values can be hand-edited per company or, per Savio's docs, synced from Salesforce, HubSpot, or Segment.
What does revenue-weighted prioritization cost in Savio?
The manual version works on every tier, including the 14-day trial: you can hand-edit each company's MRR and the columns, filters, and reports all work. The automated feed is gated by plan. Essential is $39/mo and Professional is $79/mo, and both limit you to support-tool attributes or manual edits. The Salesforce, HubSpot, and Segment sync that keeps MRR current automatically requires the Business tier at $249/mo.
Do you need a CRM to prioritize feature requests by revenue?
You need a revenue number per customer and a link between feedback and customers. A CRM is one way to get the number, and it is the path Savio automates on its Business tier. If your product is software you ship yourself, your own code already knows who the user is and what they pay, so the number can arrive from an identify() call at login instead of a CRM integration.
How does Usero's version of revenue weighting work?
Usero already links feedback to a Person record via its identify() call. We added an mrr trait: pass identify({ traits: { mrr: 499 } }) from your own code and the number lands on the person. The inbox and the AI clusters then show revenue sums computed over distinct people, so five tickets from one $500 customer count as $500, not $2,500, and you can sort by revenue. It is a first slice, in review as of late July 2026, and cluster-level weighting is the part we care about most: Usero groups feedback automatically, so the dollar figure lands on a theme without anyone triaging requests by hand.
Continue reading
How to Sync User Feedback With Linear Issues, Both Ways
A one-way push to Linear creates an issue and stops watching it. Here is what two-way sync between a feedback inbox and Linear should do (create, import, status back, a direction switch), the setup steps, and the two-minute test that tells you whether it is real.
5 min read
Meta's AI Crawler Crashing My DB, and What I Did About It
Sentry said one user caused 80% of my errors in two weeks. It was Meta's AI crawler, and my code was doing five database queries to tell it 404. I don't want to block it, so I fixed the code instead.
5 min read
How to Connect User Feedback to Claude Code and Cursor With a Feedback MCP Server
Six feedback tools now ship MCP servers. Here is what a feedback MCP server gives an agent, how to wire one into Claude Code, Cursor, Claude Desktop, OpenCode or Codex over OAuth, and a worked example that ends with the agent asking the tool to open the pull request.
9 min read
Build a feedback loop your team actually uses
Usero collects, clusters, and turns user feedback into shipped fixes.
Get started free